Pages

Friday, November 24, 2017

Friday Fun LII - Circular Plots

Aloha,

Slowly getting into the charting business ;)
After Thomas Nield (@thomasnield9272) pointed me to so called Circular Plots I've couldn't hold back. If you know these charts you might understand why I was so keen on creating such a chart. 
So to give you an example here is an image of such a chart...


To be honest when I first saw the plot I was fascinated even without knowing how to read it and without knowing what this chart is good for. But after I took a look at more and more of those charts I got an idea on how to use them.
So I'm not a data scientist which is the reason why I've implemented it in a way that seemed logical for me.
The biggest problem was to find some data that I could use for the visualization. So in the end I've decided to take the public available data from the current parliamentary election in Germany.
To give you an idea what my chart is visualizing I think I need to explain it a bit. Each section on the chart shows one party with it's name, color and the voting result related to the number of eligible voters (61.5 Million).
Because there was a new party this year it was interesting to see where did the voters came from, so my chart visualizes the migration from all parties to other parties. The bigger the arrow the more voters migrated from the party to another.
So here is my chart...


So in the chart one can see that most of the AfD voters came from the Union party, the so called Non-Voters ("Nichwaehler") and others.
I've also created another chart that shows fictive data about travellers that travel between some asian countries. As always I do not have any use case for this chart and cannot guarantee that it is useful for real data analysis but at least it works for me and was fun to create. So here is the other chart...


At the moment there is not interactivity in this chart but if I will find some time I will definitely add it.

As always you can find the code on github.

That's it for today...enjoy the upcoming weekend and...keep coding ;)

Monday, November 20, 2017

Just some conversion tool...

Aloha,

Last week I was in Switzerland and somehow got reminded on some tool that I've created some time ago which might be handy for some of you. It is a simple unit conversion tool which supports conversion between the following categories of units:
- ACCELERATION 
- ANGLE 
- AREA 
- DATA 
- CURRENT 
- ELECTRIC_CHARGE 
- ENERGY 
- FORCE 
- HUMIDITY 
- LENGTH 
- LUMINANCE 
- LUMINOUS_FLUX 
- MASS 
- PRESSURE 
- SPEED 
- TEMPERATURE 
- TEMPERATURE_GRADIENT 
- TIME 
- TORQUE 
- VOLUME 
- VOLTAGE 
- WORK
As an example let's convert a temperature in Celsius in Fahrenheit and Kelvin which would 
look as follows: 
Converter temperatureConverter = new Converter(TEMPERATURE, CELSIUS);

double celsius    = 32.0;
double fahrenheit = temperatureConverter.convert(celsius, FAHRENHEIT);
double kelvin     = temperatureConverter.convert(celsius, KELVIN);

System.out.println(celsius + "°C => " + fahrenheit + "°F => " + kelvin + "°K");

So first you create a Converter instance with a category and a base unit (here Temperature 
as category and Celsius as base unit).
After that is done you can convert celsius based temperatures to other units like 
Fahrenheit and Kelvin.
In addition I've also added a method to shorten long numbers with abbreviations. 
Sometimes this is really useful when working with big numbers, 
a little example would look like follows...

System.out.println(Converter.format(1_500_000, 1));

System.out.println(Converter.format(1_000_000, 0)); 
And the result will look like this... 

1.5M 

1M

The format method will support the following abbreviations
- kilo 
- Mega 
- Giga 
- Tera 
- Peta 
- Exa 
- Zetta 
- Yotta

Not really sure if you can use it but at least I wanted to share it with you folks... :) The code is as always available on github. That's it for today...keep coding...

Friday, November 17, 2017

Friday Fun LI - Horizon Charts

Aloha,

Another Friday and again time for some fun... :)
Last week someone pointed me to so called horizon charts which are a really nice way to visualize data in a compact way.
To give you an idea what they look like here is an example...


The idea behind it is to reduce the amount of space and preserve the information by splitting a graph in the vertical direction in so called bands.

The following image will show how it works (it was taken from here)...


As you can see in the image above first you flip the negative values to the positive side by inverting them (2nd graph).
Now you split the vertical axis in bands and place all of them on the 0 value of the y-axis. The image above shows an example for 1 band, 2 bands, 3 bands and 4 bands.
For every band you change the color (usually from a lighter to a darker color). So you get some kind of a heat map where darker colors visualize higher values.

So my JavaFX implementation looks like follows for some random data...


For the implementation of this chart I used the JavaFX Canvas node again which should also work with lots of data because it will only use 1 node on the scene graph. So the HorizonChart will take 2 nodes on the scene graph, one for the Region and one for the Canvas.
At the moment you can split the graph in up to 5 bands which seems to be enough for most of the visualizations I've found.
To get nice colors for the chart I've also added some convenience methods in the Helper class to create color variations for a given color.
For example let's assume you would like to visualize positive values with shades of blue and negative values with shades of red and you will use 4 bands.
To create the colors simply use the following code...


List<Color> positiveColors = Helper.createColorVariationsAsList(Color.BLUE, 4);
List<Color> negativeColors = Helper.createColorVariationsAsList(Color.RED, 4);

Now you can set these colors on the chart instance as follows...


HorizonChart chart = new HorizonChart(4, series);
chart.setPositiveColors(positiveColors);
chart.setNegativeColors(negativeColors);

The HorizonChart doesn't come with any axis or bounds which should make it easy to implement it in your own more feature rich chart. Meaning to say the chart will always take the whole space you defined for it using the setPrefSize() method.
So you decide the size of the chart and the chart will scale it's content always to the defined area.
When using not so many data points you might want to smooth the chart which is possible by using the setSmoothed() method of the chart or by setting the smoothed value in the constructor (usually you don't need smoothing in this kind of chart because it is normally used to visualize big datasets).


The HorizonChart will listen to changes in the Series of Data objects and will redraw itself when changes occur.
If you just change the value in the existing Data objects the chart won't notice but you have to explicitly call the charts redraw() method.

The Series will also fire SeriesEvents  which will be used to either redraw the chart or select data in the chart. In the provided Demo class you will see that I simply fire one SeriesEvent of SeriesEventType.REDRAW to redraw all charts because they are all using the same Series. Otherwise I would have to call the redraw() method of each chart after I've changed the data.

The HorizonChart also supports mouse interaction where you can click somewhere in the chart and it will show the current Data object values in a tooltip. In addition a SeriesEvent of type SeriesEventType.SELECT_DATA will be fired. By adding a SeriesEventListener to the Series you can get the selected data information from the SeriesEvent which contains the Data object of the selected point (just take a look at the provided Demo which prints the data of the selected point to the console).

The toString() methods of the Point, Data and Series class will return a JSON String which might come in handy sometimes.

Another thing that could be useful is the ability to decide if the reference value should be 0 or the first y-value in the Series items.
If you would like to visualize stock data you usually start with a given stock value. In this case you would like to use the first y-value of the data list as reference value and all following data should be visualized as negative value if it is below the reference and as positive value if it is above the reference value. In this case just call setReferenceZero(false) method.
But if you would like to visualize data that is alternating around zero (like the cos values in the provided Demo) you simply leave the reference value to 0 (which is the default value).

I think that's more or less everything I have to offer today...so I hope some of you can use it...I for myself have again no use for it :)

Oh and if you need something special or have an idea for a special graph/chart/control...just let me know.
 
And as always you can find the source code over at github

Enjoy your weekend and...keep coding... :)

Friday, November 10, 2017

Friday Fun L - Smooth Charts

Aloha,

If you ever worked with JavaFX charts you might know the need for smoothed line- and areacharts. 
If you search the web you will probably stumble upon an implementation over at fxexperience.com. I've used this version from Jasper for some time and it worked for me in 80% of all cases.
But sometimes you need more features or dynamic behavior and for TilesFX I've created a new version of such a chart which comes with the following features

  • line or area chart
  • smoothed or not smoothed
  • supports mouse interaction (click on the chart and get the y-value)
  • supports snap to ticks (click on the chart and the next point will be selected)
  • convenience methods
    • set visibility of symbols 
    • set series fill
    • set series stroke
    • set symbol background
    • set legend background
    • set legend text fill
    • set legend symbol background
    • set symbol size
    • get symbols (List<StackPane>)
    • get fillPath
    • get strokePath
    • get chart plot background
    • get horizontal/vertical gridlines
    • set chart plot background fill/background
    • set x-axis and y-axis tick label fill
    • set x-axis and y-axis tick mark fill
    • set x-axis and y-axis border fill

I'm not sure if these features will be useful for all of you but even if not I thought it might be worth sharing it with you. In principle most of those features I could have set using CSS but if I need to set it via code I always have to check the css styles etc. So for this reason I've added all those convenience methods :)

To smooth the chart I use a so called Catmull-Rom spline which has the advantage that it is tightly follows the control points of the chart.

The chart also comes with a property to change the number of points between the control points. Means if you just need a rough smoothing you could try a value of 2 or if you need a fine smoothing you might want to try 32 (the limit is 64 in my implementation). The default value is 16 and this gives nice results, so usually you don't need to change it. This factor depends on the size of the chart. For smaller charts even 8 gives nice results.

So here is a screenshot of the all four chart variants...


The code for this charts can be found in the Demo.java file that comes with the chart. Because in TilesFX I needed a smoothed chart which I can tweak from code without using CSS I've added a couple of convenience methods. If you use this chart as a replacement for a standard JavaFX AreaChart all the CSS stuff should also work. But if you (like me) need to tweak some things dynamically the convenience methods come in quite handy.

Here is a little video that show the mouse interactivity in action...


If the interactive property is set to true the the chart will fire a JavaFX event of type SmoothedChartEvent.DATA_SELECTED
The event contains a double property that contains the y value of the selected point. To get those events you have to add an EventHandler to the chart object as follows...


SmoothedChart<String, Number> areaChartSmoothed = new SmoothedChart<>(xAxis4, yAxis4);
areaChartSmoothed.getData().addAll(series4);
areaChartSmoothed.setSmoothed(true);
areaChartSmoothed.setChartType(ChartType.AREA);
areaChartSmoothed.setInteractive(true);
areaChartSmoothed.setSubDivisions(8);
areaChartSmoothed.setSnapToTicks(false);
areaChartSmoothed.setLegendVisible(false);

areaChartSmoothed.addEventHandler(SmoothedChartEvent.DATA_SELECTED, 
                                  e -> System.out.println(e.getValue()));

The tooltip shows different information dependent on the mode
  • snapToTicks = true  -> The name and the value of the selected Data object
  • snapToTicks = false -> The y-value of the selected point
It might be possible that you need more or different functionality so...feel free to fork the code on github as always :)

Just be aware that this class won't work in Java 9 in the current state because it makes use of the following internal api

  • com.sun.javafx.charts.Legend
  • com.sun.javafx.charts.Legend.LegendItem

These classes will be used in the following methods:

setLegendBackground() 
setLegendTextFill() 
setLegendSymbolFill()

So you could either remove those methods and it will run on JDK 9 or you have to fiddle around with some JVM command line parameters like

--add-exports javafx.controls/com.sun.javafx.charts=ALL_UNNAMED

To be honest I did not try that yet but it might work, otherwise just let me know and I will correct this blogpost :)

Well that's it for today...so keep coding... :)

Friday, November 3, 2017

Friday Fun XLIX SunburstChart

Aloha again,

Last weekend I was looking for dashboards on the web and stumbled upon some nice charts that I found really interesting.
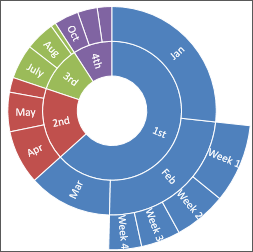
These charts are called RadialTreeMaps or SunburstCharts and one that I've found (guess it is from Excel) looks as follows...


It really represents a forward directed tree structure in a radial layout where the root node itself is not really visible. First of all I thought that might be easy because it looks like a multi-donut chart and in principle this is correct but the difference is the tree structure of this chart.

So it took some early morning hours to figure out how to get it right. So the first thing that I needed was a tree structure that is able to hold the data of this chart. 
Therefor I created one which works good enough for my chart and is build from one class.
The TreeNode class that I use to build the tree structure will also fire TreeNodeEvents of Type EventType.PARENT_CHANGED and EventType.CHILDREN_CHANGED so that you can register a listener to those events and react on changes of the tree.

Update:
I've changed the behavior in the way that all tree nodes fire their event via the root node of the tree. Means you just have to hook up a listener to the root of the tree to get informations.

The final idea behind this chart is to add it to TilesFX so I will use the same ChartData class in the tree structure.
I've decided to make use of the JavaFX canvas node again to keep the number of nodes on the scene graph low. This comes with the drawback that it is not trivial to implement mouse event handling for the segments. So in this version I don't support any mouse event handling. But I think I will also create a node based version...maybe during the next weekend :)
To create a graph like this you first have to setup the underlying tree. With my TreeNode class this will look like follows:


TreeNode tree   = new TreeNode(new ChartData("ROOT"));
TreeNode first  = new TreeNode(new ChartData("1st", 8.3, PETROL_0), tree);
TreeNode second = new TreeNode(new ChartData("2nd", 2.2, PINK_0), tree);
TreeNode third  = new TreeNode(new ChartData("3rd", 1.4, YELLOW_0), tree);
TreeNode fourth = new TreeNode(new ChartData("4th", 1.2, GREEN_0), tree);

TreeNode jan    = new TreeNode(new ChartData("Jan", 3.5, PETROL_1), first);
TreeNode feb    = new TreeNode(new ChartData("Feb", 3.1, PETROL_1), first);
TreeNode mar    = new TreeNode(new ChartData("Mar", 1.7, PETROL_1), first);
TreeNode apr    = new TreeNode(new ChartData("Apr", 1.1, PINK_1), second);
TreeNode may    = new TreeNode(new ChartData("May", 0.8, PINK_1), second);
TreeNode jun    = new TreeNode(new ChartData("Jun", 0.3, PINK_1), second);
TreeNode jul    = new TreeNode(new ChartData("Jul", 0.7, YELLOW_1), third);
TreeNode aug    = new TreeNode(new ChartData("Aug", 0.6, YELLOW_1), third);
TreeNode sep    = new TreeNode(new ChartData("Sep", 0.1, YELLOW_1), third);
TreeNode oct    = new TreeNode(new ChartData("Oct", 0.5, GREEN_1), fourth);
TreeNode nov    = new TreeNode(new ChartData("Nov", 0.4, GREEN_1), fourth);
TreeNode dec    = new TreeNode(new ChartData("Dec", 0.3, GREEN_1), fourth);

TreeNode week1  = new TreeNode(new ChartData("Week 1", 1.2, PETROL_2), feb);
TreeNode week2  = new TreeNode(new ChartData("Week 2", 0.8, PETROL_2), feb);
TreeNode week3  = new TreeNode(new ChartData("Week 3", 0.6, PETROL_2), feb);
TreeNode week4  = new TreeNode(new ChartData("Week 4", 0.5, PETROL_2), feb);

With this we have setup the tree and now we only have to create the control itself. To make it easier I've created a SunburstChartBuilder. So the code to create a sunburst chart like the one on the image above will look like follows:


SunburstChart sunburstChart = 
    SunburstChartBuilder.create()
                        .prefSize(400, 400)
                        .tree(tree)
                        .textOrientation(TextOrientation.TANGENT)
                        .useColorFromParent(false)
                        .visibleData(VisibleData.NAME)
                        .backgroundColor(Color.WHITE)
                        .textColor(Color.WHITE)
                        .decimals(1)
                        .interactive(false)
                        .build();

Now you just have to add this node to your scene graph and you should see something like this...


Not too bad :)

As you can see the control comes with the following properties
  • backgroundColor
  • textColor
  • visibleData (NONE, VALUE, NAME, NAME_VALUE)
  • textOrientation (HORIZONTAL, TANGENT, ORTHOGONAL)
  • decimals (0 - 5)
  • useColorFromParent (true, false)
  • interactive (true, false)
  • autoTextColor (true, false)
  • brightTextColor 
  • darkTextColor
  • useChartDataTextColor (true, false)
One can define a text color in the ChartData objects and if you would like to use the color defined in there you should set useChartDataTextColor to true.

You also have the ability to only define the fill color in the ChartData objects and let the chart automatically adjust the text color dependent on the segment fill color.
Therefor you can define a brightTextColor that will be used for dark segment fills and a darkTextColor that will be used for bright segment fills. The default bright text color is Color.WHITE and the default dark text color is Color.BLACK.

The useColorFromParent property can be used to set the color of all children of one group to the same color as the group root. Means the color of each ChartData object will be ignored except the one of the group root node.
So if I switch it on for the example above the result will look like this...

As you can see now all children of each group have the same color as the root node of this group. If you use this feature you just have to define the colors for the four root nodes (1st, 2nd, 3rd, 4th).

Means the code of the tree for the above chart would look like follows:


TreeNode tree   = new TreeNode(new ChartData("ROOT"));
TreeNode first  = new TreeNode(new ChartData("1st", 8.3, PETROL_0), tree);
TreeNode second = new TreeNode(new ChartData("2nd", 2.2, PINK_0), tree);
TreeNode third  = new TreeNode(new ChartData("3rd", 1.4, YELLOW_0), tree);
TreeNode fourth = new TreeNode(new ChartData("4th", 1.2, GREEN_0), tree);

TreeNode jan    = new TreeNode(new ChartData("Jan", 3.5), first);
TreeNode feb    = new TreeNode(new ChartData("Feb", 3.1), first);
TreeNode mar    = new TreeNode(new ChartData("Mar", 1.7), first);
TreeNode apr    = new TreeNode(new ChartData("Apr", 1.1), second);
TreeNode may    = new TreeNode(new ChartData("May", 0.8), second);
TreeNode jun    = new TreeNode(new ChartData("Jun", 0.3), second);
TreeNode jul    = new TreeNode(new ChartData("Jul", 0.7), third);
TreeNode aug    = new TreeNode(new ChartData("Aug", 0.6), third);
TreeNode sep    = new TreeNode(new ChartData("Sep", 0.1), third);
TreeNode oct    = new TreeNode(new ChartData("Oct", 0.5), fourth);
TreeNode nov    = new TreeNode(new ChartData("Nov", 0.4), fourth);
TreeNode dec    = new TreeNode(new ChartData("Dec", 0.3), fourth);

TreeNode week1  = new TreeNode(new ChartData("Week 1", 1.2), feb);
TreeNode week2  = new TreeNode(new ChartData("Week 2", 0.8), feb);
TreeNode week3  = new TreeNode(new ChartData("Week 3", 0.6), feb);
TreeNode week4  = new TreeNode(new ChartData("Week 4", 0.5), feb);

Here you see that we defined the colors only for the four root nodes of the chart.

Update:
After I spend another early morning now the control also supports interactivity. I've added an interactive property to the control which default value is false. In this case the chart is drawn by using the JavaFX canvas node only (for all charts this leads to 3 nodes on the scene graph). 
If you switch interactivity on the chart will be drawn using JavaFX Path elements. In this case the number of nodes on the scene graph will depend on the number of segments in the chart (for the the chart above it leads to 31 nodes).

The control contains a demo that you can start on the console with

gradle demo

This will start the following application:


The chart on the left side is the Canvas based chart where you don't have any interaction at all. The chart on the right side is the interactive chart that makes use of Path elements. 
Here you have a tooltip when you hover over a segment and if you click a segment it will fire a TreeNodeEvent of type EventType.NODE_SELECTED. With this feature you could hook up a listener to the root node of your tree structure and get notified when someone clicks on a segment.

So in principle this control contains two approaches, one that saves nodes on the scene graph with the cost of no interaction and the other which comes with interaction but with the cost of more nodes on the scene graph...it's your choice :)

As always you can find the code on github and you would like to start the demo that is part of the source code you simply have to pull the source code from github and start the demo on the console with

gradle demo

That's it for today, so enjoy the upcoming weekend and do not forget...keep coding... ;)