Wednesday, May 17, 2023

Keep track of your Java inventory...

JavaFinder

Do you ever wondered how many Java distributions you have installed on your machine? I not only mean versions that you use for development but also versions that come bundled with an application. Last weekend I've decided to write a little tool that can help me figuring that out...JavaFinder.

This is a simple command line tool that will search a given path including it's subfolders for any OpenJDK distribution or GraalVM derivate. So it's nothing really fancy but could be useful sometimes.


Usage

Per default it will print all distributions found in json format on the console, when I run it on my Macbook Pro without any parameters like this javafinder, the output will look as follows

{
   "search_path":"/System/Volumes/Data/Library/Java/JavaVirtualMachines",
   "sysinfo":{
      "operating_system":"macos",
      "architecture":"arm64",
      "bit":"64"
   },
   "distributions":[
      {
         "vendor":"Azul",
         "name":"Zulu",
         "version":"17.0.7",
         "path":"/System/Volumes/Data/Library/Java/JavaVirtualMachines/zulu-17.jdk/zulu-17.jdk/Contents/Home/",
         "build_scope":"OpenJDK"
      },
      {
         "vendor":"Azul",
         "name":"Zulu",
         "version":"8.0.372+7",
         "path":"/System/Volumes/Data/Library/Java/JavaVirtualMachines/zulu-8.jdk/zulu-8.jdk/Contents/Home/jre/",
         "build_scope":"OpenJDK"
      },
      {
         "vendor":"Azul",
         "name":"Zulu",
         "version":"8.0.372+7",
         "path":"/System/Volumes/Data/Library/Java/JavaVirtualMachines/zulu-8.jdk/zulu-8.jdk/Contents/Home/",
         "build_scope":"OpenJDK"
      },
      {
         "vendor":"Azul",
         "name":"Zulu",
         "version":"11.0.19",
         "path":"/System/Volumes/Data/Library/Java/JavaVirtualMachines/zulu-11.jdk/zulu-11.jdk/Contents/Home/",
         "build_scope":"OpenJDK"
      },
      {
         "vendor":"Azul",
         "name":"Zulu",
         "version":"20.0.1",
         "path":"/System/Volumes/Data/Library/Java/JavaVirtualMachines/zulu-20.jdk/zulu-20.jdk/Contents/Home/",
         "build_scope":"OpenJDK"
      },
      {
         "vendor":"Oracle",
         "name":"Graal VM CE",
         "version":"22.3.1",
         "path":"/System/Volumes/Data/Library/Java/JavaVirtualMachines/graalvm-ce-java17-22.3.1/Contents/Home/",
         "build_scope":"GraalVM"
      },
      {
         "vendor":"Azul",
         "name":"Zulu",
         "version":"21-ea+21",
         "path":"/System/Volumes/Data/Library/Java/JavaVirtualMachines/zulu-21.jdk/zulu-21.jdk/Contents/Home/",
         "build_scope":"OpenJDK"
      },
      {
         "vendor":"Gluon",
         "name":"Gluon GraalVM",
         "version":"22.1.0.1",
         "path":"/System/Volumes/Data/Library/Java/JavaVirtualMachines/gluon-graalvm/Contents/Home/",
         "build_scope":"GraalVM"
      }
   ]
}


Well that's not completely true because the output is not formatted like this but in a more compact format without linebreaks and intendation. If you prefer something more simple there is also the possibility to output the results in csv format. In this case you need to run the program as follows ```javafinder csv```and the output will look like follows:


Vendor,Distribution,Version,Path,Type
Azul,Zulu,21-ea+21,/System/Volumes/Data/Library/Java/JavaVirtualMachines/zulu-21.jdk/zulu-21.jdk/Contents/Home/,OpenJDK
Oracle,Graal VM CE,22.3.1,/System/Volumes/Data/Library/Java/JavaVirtualMachines/graalvm-ce-java17-22.3.1/Contents/Home/,GraalVM
Azul,Zulu,20.0.1,/System/Volumes/Data/Library/Java/JavaVirtualMachines/zulu-20.jdk/zulu-20.jdk/Contents/Home/,OpenJDK
Azul,Zulu,11.0.19,/System/Volumes/Data/Library/Java/JavaVirtualMachines/zulu-11.jdk/zulu-11.jdk/Contents/Home/,OpenJDK
Azul,Zulu,8.0.372+7,/System/Volumes/Data/Library/Java/JavaVirtualMachines/zulu-8.jdk/jre/,OpenJDK
Azul,Zulu,8.0.372+7,/System/Volumes/Data/Library/Java/JavaVirtualMachines/zulu-8.jdk/,OpenJDK
Azul,Zulu,20.0.1,/System/Volumes/Data/Library/Java/JavaVirtualMachines/zulu-20.jdk/,OpenJDK
Azul,Zulu,21-ea+21,/System/Volumes/Data/Library/Java/JavaVirtualMachines/zulu-21.jdk/,OpenJDK
Gluon,Gluon GraalVM,22.1.0.1,/System/Volumes/Data/Library/Java/JavaVirtualMachines/gluon-graalvm/Contents/Home/,GraalVM
Azul,Zulu,8.0.372+7,/System/Volumes/Data/Library/Java/JavaVirtualMachines/zulu-8.jdk/zulu-8.jdk/Contents/Home/,OpenJDK
Azul,Zulu,17.0.7,/System/Volumes/Data/Library/Java/JavaVirtualMachines/zulu-17.jdk/,OpenJDK
Azul,Zulu,11.0.19,/System/Volumes/Data/Library/Java/JavaVirtualMachines/zulu-11.jdk/,OpenJDK
Azul,Zulu,17.0.7,/System/Volumes/Data/Library/Java/JavaVirtualMachines/zulu-17.jdk/zulu-17.jdk/Contents/Home/,OpenJDK
Azul,Zulu,8.0.372+7,/System/Volumes/Data/Library/Java/JavaVirtualMachines/zulu-8.jdk/zulu-8.jdk/Contents/Home/jre/,OpenJDK

```

On Linux and Mac you simply can save that into a file using javafinder csv > jdks.csv


In the examples above I did not specify any paths to search for distributions which will make JavaFinder search in

pre-defined folders for each operating system

- Windows: C:\Program Files\Java\

- Linux: /usr/lib/jvm

- MacOS:  /System/Volumes/Data/Library/Java/JavaVirtualMachines/


In case you would like to search in a specific path you can simply add it to the command as follows:

- MACOS
  Search all paths in /Users/hansolo by executing
  >: javafinder /Users/YOUR_USER_NAME -> output will be in json format
  >: javafinder csv /Users/YOUR_USER_NAME -> output will be in csv format

- LINUX
  Search all paths in your home folder
  >: javafinder /home/YOUR_USER_NAME -> output will be in json format
  >: javafinder csv /home/YOUR_USER_NAME -> output will be in csv format

- WINDOWS
  Search all paths in your home folder
  >: javafinder.exe c:\Users\YOUR_USER_NAME -> output will be in json format
  >: javafinder.exe csv c:\Users\YOUR_USER_NAME -> output will be in csv format


ATTENTION:

Please be aware that scanning for distributions can take some time, esp. when you point to a path like your user home folder etc. The less subfolders are in the given path, the faster the scanning will be.


Download

JavaFinder is available for Windows (x64), Linux (x64 and aarch64) and MacOS (x64 and aarch64) and you can find it over at github

That's it for today...keep coding...

Thursday, March 3, 2022

DiscoCLI

 Aloha,

As some of you might know I've created the so called DiscoAPI for foojay.io. This api should help you to get an OpenJDK distribution of your choice. In addition to the api itself I've also created different plugins for IDE's and browsers and also some tools like JDKMon.

That's all good stuff but I was always missing a command line tool which enables me to simply download an OpenJDK package of my choice in the terminal. Thank god there is Picocli which makes it possible to create a command line interface using Java.

If you use Picocli in combination with GraalVM's native image feature you can create a single binary which was exactly what I was looking for.

And even better...you can build the binaries for x64 based platforms easily using github actions.

Long story short, I've created the Disco Command Line Client or short DiscoCLI which makes it easy to download an OpenJDK distribution of your choice.


Here are some examples on how to use it:

Get Zulu with version 17.0.2 for the current operating system including JavaFX:

discocli -d zulu -v 17.0.2 -fx


Get the latest version of JDK 16 for Liberica on Windows:

discocli -d liberica -v 16 -os windows -latest


Get the JDK 17.0.2 of temurin for macos with aarch64 as a tar.gz and store it to a folder

discocli -d temurin -v 17.0.2 -os macos -arc aarch64 -at tar.gz -p /Users/hansolo


In case a JDK pkg cannot be found discocli will try to give you the available pkgs.

discocli -d liberica -v 12 -os linux -arc x64 -fx -latest

Sorry, defined pkg not found in Disco API

Packages available for Liberica for version 12:
discocli -d liberica -v 12.0.2 -os linux -lc glibc -arc amd64 -at tar.gz -pt jdk
discocli -d liberica -v 12.0.1 -os linux -lc glibc -arc amd64 -at tar.gz -pt jdk
discocli -d liberica -v 12 -os linux -lc glibc -arc amd64 -at tar.gz -pt jdk

It's also possible to simply check what packages are available for given set of parameters. If we would like
to know what packages are available of Zulu for Macos on aarch64 that come as tar.gz and offer a jdk for 
version 17.0.2, we could type the following:

discocli -f -d zulu -v 17.0.2 -os macos -arc aarch64 -pt jdk -at tar.gz

Packages found for Zulu for version 17:
discocli -d zulu -v 17.0.2 -os macos -lc libc -arc x64 -at tar.gz -pt jdk -fx
discocli -d zulu -v 17.0.2 -os macos -lc libc -arc x64 -at tar.gz -pt jdk

As always the code is available on github if you would like to build it yourself but if you simply would
like to download the binary, feel free to get it from the github releases.
I provide binaries for the following platforms:
- Macos x64 (but this also works on M1 chips because of Rosetta 2)
- Linux x64
- Linux aarch64
- Windows x64

For those of you that are asking themselves if this is not the same as SDKMan? No, it's not, SDKMan is much more
than this. DiscoCLI really only helps you downloading an OpenJDK distribution and that's it, no installation 
and nothing else than OpenJDK distributions. 
And in the near future DiscoCLI might also be available via SDKMan using JReleaser... :)

That's it for today...so keep coding... :)

Saturday, January 15, 2022

GlucoStatusFX

Aloha,

Two years ago I wrote an iOS app to monitor the diabetes of our son. This app (GlucoTracker) is written in Swift using SwiftUI and I still use it today on my iPhone and my AppleWatch.

After I've created that app I decided it would be nice to also have such an app on my Mac and so I wrote a Macos app using Swift and SwiftUI (GlucoStatus) that I run on all of my Macs.

Last week I thought by myself it might be a nice exercise to port this native Swift Macos app to JavaFX. Well I was really surprised how easy it was to rewrite this app in Java (I'm just more used to Java than to Swift which might be the main reason for this).

So the app gets it's data from a Nightscout server that you have to setup to monitor the blood glucose values. And in addition you somehow need to feed the blood glucose data into the Nightscout server which usually is done by using a specific sensor like the Dexcom G6, the Freestyle Libre, Enlight or others.

Meaning to say without a Nightscout server my app is useless.

But if you have such a server in place you should be able to use the app.

So the main screen looks as follows:


In the upper (colored) part you will see the current value in large letters. Below it you will find the 5 last delta values which can help you to figure out the current trend (this assumes that the values from you sensor will be updated in intervals of 5 minutes.

Then there is the date and time of the last update and the average of the selected range.

On top of the window you can select the range that should be visualized and used for the statistics.

To setup the application you can click on the little button with the gear on the upper right corner and it will show you the following screen:


In the preferences screen you first of all have to set the url of your nightscout server (e.g. https://YOUR-DOMAIN.herokuapp.com).

In addition you can define if you would like to get notifications for different situations (e.g. the value is low, or acceptable low etc.). Except for the "too low" and "too high" situations you can define whether you would like to get a notification. For all situations you can enable/disable an additional sound that will be played with the notification.

Then you can also define intervals for situations like "too low" or "too high". This means that for example if your blood glucose value is too high the app will show you a notification with the given interval (e.g. every 5 minutes or every 20 minutes etc.)

In the lower part of the preferences screen you can then also define the different ranges that you would like to use (e.g. normal values should be within the range of 70-110 mg/dl etc.)

You could also switch to another unit that is more often used in the US which is mmol/l instead of mg/dl.

On the main screen you will also find 3 icons in the colored area. The rounded arrow on the upper right corner will reload the values (this is usually not needed, only in case you would manually update the values). 

The app pings the Nightscout server every minute to check for the latest value.

The icon on the lower right will show you the "time in range" chart which looks as follows:


This chart will simply show you how often your blood glucose values have been in the defined ranges in the given time range (defined by the buttons on top of the main screen e.g. 7 days, 24 hours etc.)

The last icon that you will find on the lower left corner will show you a pattern view of the values from the last week and it looks as follows:


On top you will find the HbAc1 value that is calculated from the last 30 days. Below that you will find a list of patterns that have been identified by the app.

And at the bottom you will see a chart based on the values from the last week that shows the median of all values of a given hour of the day. This makes it possible to identify times where your values are too high or too low. The gray shaded area covers the percentiles between 10 and 90%.

Like I said in the beginning the main reason for doing this was to see how easy it is to port an existing Swift app to JavaFX and give it more or less the same look and feel.

Because I originally created the app for Macos, I did not create a version that looks like a native Windows version yet but it will always look like on the images above.

Because Macos has some special controls (e.g. the Switch), I created a little helper library called AppleFX that you can also find on github and maven central. It does not cover all available controls but only the ones I needed for this app. But if I will find more time I will probably add more Macos controls to the libray.

Be aware that you also need my Toolbox and ToolboxFX libraries to use the AppleFX lib.

As always you can find the source code and also the binaries over at github.

There are no versions for Linux yet because this is again an app that runs in the background and sits in the system tray. Unfortunately this is not really supported on Ubuntu at the moment which is the reason why I did not created installers yet. But I will work on that and will probably add them in the future.

This does not mean that it does not work on Ubuntu, you can run it, create the installers and so on but it does not behave like it should because it should sit in the menu bar and that does not really work yet.

Here are also the links to the latest release:


One last thing...the app is localized and currently I support Germany and English but it would be awesome I could provide more localizations for other languages...so if you are willing to help...you are very welcome...just create a pull request on github or ping me.

And that's it for today...so enjoy your weekend and keep coding...


Wednesday, January 5, 2022

Holiday fun...

 Aloha and a happy new year...

I took the first week of 2022 off and because I love coding I was looking for something that I might add to one of my libraries.

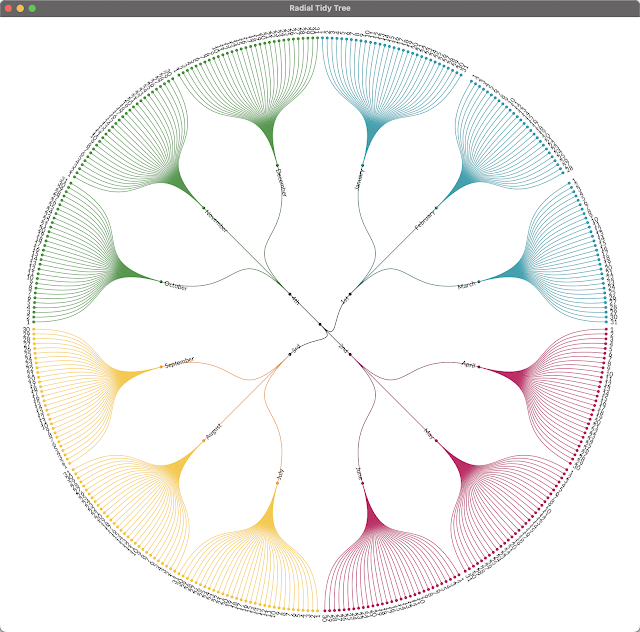
It was not too hard to find something interesting and I decided to give it a try...the Radial Tidy Tree...

For those of you that have no idea what I am talking about...here is a little example from the web...


It is a tree structure that is visualized using a radial layout.

Looks like a fun thing to do but it really gave me some time to get it right. First of all (as nearly always) I had no real use case for it but just wanted to be able to create a chart like that.

So I decided to simply visualize a year. The root node has 4 child nodes, the 4 quarters and each quarter has 3 child nodes, the months of each quarter. Finally each month has it's specific number of days.

That's not real useful data but at least you can use it to create a Radial Tidy Tree. In principle it looks like an easy task but there are some things that are not that easy to solve. 

First of all you have to create the tree structure which is easy using my TreeNode class which I already used for the Sunburst chart. For this one I had to add more properties to it like x, y and angle. Thanks to the java.time package the creation of the tree was easy.

I won't show all the code here but if you like you can simply head over to github and check it out there...

The really tricky part was figuring out the angle step between the items on each level and I tried different approaches before I finally found a way that worked for me. 

Once I was able to place the items in the right place the next thing was to create all the bezier curves between the items to make it look good. And the last step was to put the text in the right position and rotate it correctly.

Well...long story short...here is the result...


And I really like the way the result looks :)

As I already mentioned, I do not have a real use case for it and therefor I cannot guarantee that the tree will work for all use cases. But I did a few other tests and it seems to be ok.

The RadialTidyTree can be found in the latest release of my charts library (17.1.2) which you can either get on github or on maven central.

As with all the charts in my charts library you can find a class that shows how to use it in the test package, for this one just look for RadialTidyTreeTest.java.

And that's it...so keep coding... :)


Friday, December 31, 2021

Harmony...finally

 Aloha,

When you create different libraries and components you find yourself writing the same code in different places over time. In principle that's ok, except you combine those libraries and components. In this case you suddenly have the same classes twice or even more often in your code base. When I started creating Medusa, TilesFX and Charts I did not really think about the possibility to combine those libraries in one project at some point in the future. The main reason for this is that I never plan to create those libraries but they simply grow from components to libraries over time. 

The thing that started me thinking about to re-use more code between those libraries was a project where I needed TilesFX and Charts in the same project. Both of these libraries came with a Country class with different properties and methods. Now in that project I needed both of them and I needed to write some ugly code to convert between them

That was the starting point of the Countries library which you can now find either on github and on maven central.

But then I saw that there are other classes that I more or less use in both libraries and I decided to put those shared classes in a separate project. Because there are projects that use JavaFX and others which don't, I decided to create two projects:

  • eu.hansolo.toolbox
  • eu.hansolo.toolboxfx

Toolbox:

This library contains the code from my Evt project, meaning to say an event system which is similar to the JavaFX events.

Then I also added the code from my Properties project to the Toolbox. The properties are very similar to the JavaFX properties incl. binding. And in the Toolbox they will use the Evt events for property changes.

There are now also tuples in the Toolbox which sometimes can come in handy. They are not that fancy and their getters and setters do look like getA(), get(B) and setA(), setB(). Not so nice but useful.

The last thing I've added is the code from my UnitConverter which contains all kinds of different units and a converter that can convert between them (in the same category e.g. Temperature).

Then there is a Helper method that contains all sorts of methods that I use here and there in my code e.g. clamp() etc.

ToolboxFX:

Then there is the ToolboxFX library which depends on JavaFX but that does not only contain JavaFX related stuff. Here you will find things like my ConicalGradient, FontMetrix, GradientLookup, the Fonts that I do use often and other stuff like Point, Bounds, CornerRadii, Dimension, Location Po, CatmullRom etc.

ToolboxFX depends on Toolbox so you need to add Toolbox too if you use ToolboxFX.

This is stuff that I use a lot in the Charts library but also in TilesFX and Medusa.

But that's not enough, I've also separated the HeatMap from Charts and Countries and put it in a separate project.

So what does that mean for you as a user of one of my libraries?

  • Update your dependencies
    • TilesFX depends on:
      • eu.hansolo:toolbox:17.0.6
      • eu.hansolo:toolboxfx:17.0.15
      • eu.hansolo.fx:heatmap:17.0.3
      • eu.hansolo.fx:countries:17.0.16
    • Medusa depends on:
      • eu.hansolo:toolbox:17.0.6
      • eu.hansolo:toolboxfx:17.0.15
    • Charts depends on:
      • eu.hansolo:toolbox:17.0.6
      • eu.hansolo:toolboxfx:17.0.15
      • eu.hansolo.fx:heatmap:17.0.3
      • eu.hansolo.fx:countries:17.0.16
  • Use the new event system
    • If you make use of things like TileEvent, you should change to TileEvt etc. The best way to see how it works is to take a look at the Demo classes within the library source code.

ATTENTION: The libraries are not backwards compatible due to the new event system !!!


The new versions of TilesFX, Charts and Medusa that will make use of the shared libraries will all start with version 17.1.0. There is still a lot of stuff to streamline (e.g. removing methods from the libraries Helper classes because they are already covered by Helper  in Toolbox and HelperFX in ToolboxFX but for that I need more time.

So here are all libraries that are new or have changed:

I will probably also use the Toolbox and ToolboxFX in future components and libraries.
So that was my holiday project and I'm really happy with it because now I could more easily use combinations of my libraries in projects.

I'm pretty sure there are still some things that do not work correctly, so please, if you stumble upon a problem do not hesitate to file an issue with some example code in the github repo.

I wish all of you a Happy New Year...and hopefully we will get rid of that Covid thing pretty soon...so stay healthy...and keep coding...


Thursday, December 23, 2021

DateRanger...

 Aloha,

Last week I needed some kind of a date picker which I can use to select ranges of dates. So I knew that I once created such a control when I was working for Canoo back in the days. But when I found it I saw that it was realized in JavaFX 2.0 that was based on JDK7 and made use of Skin and Behavior classes which changed in JDK8. 
Because I was not keen on rewriting that stuff I decided to simply create a new control...just for the fun of it :)
And because I used a lot of Canvas recently I made the decision to make use of CSS for this control and not use the Canvas node for it. Using CSS makes the whole thing more usable for standard applications because you can easily style the control to your needs where when using the Canvas node it needs more programming effort to get the same styleability.
So the first step was to figure out a control that I like to have some kind of template.
And I found this one...

It's not really fancy but I really like it's compact look which has all the info that I need. So I've created my version of it which looks as follows:


As you can see I more or less created a copy of the control. So the next step was to add the functionality to select a range of dates.
I've simply added a key listener and if you select a date by clicking somewhere with the mouse you can press the `SHIFT` key with the next click and it will create a range of dates for you.
The range then looks as follows:


Most of the nodes can be styled using CSS and you will find all the available styles in the `date-ranger.css` file.
The plain DateRanger comes without the month and year label and the buttons, so you can also use it for only showing the month. If you would like to use the version above, you can use the DateRangerControl which is also part of the code. This is in principle just a BorderPane that comes with the label and buttons on the top.

It's nothing really fancy but maybe it will be useful for one or the other.
The code is available on github and also on maven central.

Well I guess that's it for 2021...I wish all of you a merry christmas and a happy new year...oh and keep coding... :)

Sunday, December 12, 2021

A versus B

 Aloha,

last week I was searching the web for some comparison between an older iMac and an older Macbook Pro. And when I was skimming the web for such comparison pages I saw those comparison charts on some of the pages I've found.

Well I just checked "comparison chart" on Google and took a look at the images and found something like this:


And you will find a lot of similar charts on the web. This could be a really useful chart for some use cases and the best of all...it's really easy to implement :)

Long story short...here is my version of a ComparisonBarChart...


Just up front...the header with the "Product A" label and the "A" in the circle is NOT part of the chart. Because you not always need this labels I've decided to not add them to the chart itself but leave it to the user to add such things manually. So the chart only contains the bars and the categories.

More or less all of the chart is configurable, so here are just a few points that can be adjusted

- The colors of the background, the bars, the bar background, the text etc.

- The number format incl. no of decimals, percentage, shortened etc.


There are some things you have to keep in mind to make the chart and the comparison work. Because you can only compare options that are available on both things you try to compare, the charts takes 2 ChartItemSeries with identical number of items. Each item needs to have the category property set to a category. You need to use the same categories (at least they should have the same name) for both series and their items.

To create the sample above I first have created a list of categories. Then I've created 2 maps with the categories as key and the chart items as value. This can be done in one loop like this:

for (int i = 0 ; i < 5 ; i++) {
Category category = new Category("Option " + i);
categories.add(category);
optionsProductA.put(category, ChartItemBuilder.create().name("Product A (Option " + i + ")").category(category).value(0).build());
optionsProductB.put(category, ChartItemBuilder.create().name("Product B (Option " + i + ")").category(category).value(0).build());
}

Now you can create the ChartItemSeries by using it's builder and set the items to the e.g. new ArrayList<>(optionsProductA.values()).

To set the bar color for each series you can set the fill for the series for example to a LinearGradient or to a plain color.

Now you can create the ComparisonBarChart using it's builder as follows

chart = ComparisonBarChartBuilder.create(series1, series2)
.prefSize(600, 300)
.backgroundFill(Color.rgb(244, 250, 255))
.categoryBackgroundFill(new LinearGradient(0, 0, 0, 1, true, CycleMethod.NO_CYCLE,
new Stop(0.0, Color.rgb(244, 250, 255)),
new Stop(0.05, Color.WHITE),
new Stop(0.95, Color.WHITE),
new Stop(1.0, Color.rgb(244, 250, 255))))
.barBackgroundFill(Color.rgb(232, 240, 252))
.barBackgroundVisible(true)
.shadowsVisible(true)
.textFill(Color.WHITE)
.categoryTextFill(Color.rgb(64, 66, 100))
.shortenNumbers(false)
.sorted(false)
.order(Order.DESCENDING)
.numberFormat(NumberFormat.PERCENTAGE)
.doCompare(false)
.categorySumVisible(false)
.betterColor(Color.BLUE)
.poorerColor(Color.RED)
.build();

To create the chart above you don't need to set all the options that you see in the code above. I've simply added it to show that they are available. For example .doCompare(false), .sorted(false), .categorySumVisible(false), .order(Order.DESCENDING) etc. are all not needed in this case.

If you only would like to compare two feature sets than this is all you need but if you would like to do more...well you can :)

You can for example sort the bars either ascending or descending by the sum of each category items. Meaning to say order it by the sum of the left and the right bar value of each category. This sum can also be shown by setting categorySumVisible to true.

If you set doCompare to true the color of the bars will change so that the one with the higher value (which is always be the "better" value in this chart) get's a different color than the bar with the smaller value (which always is the "poorer" value in this chart). There are some default colors like green for better and orange for poorer but these colors can also be set.

In addition you can also switch some visual effects on by setting shadowsVisible = true. This will add a shadow to each bar and also to the category area (the rectangle in the center of the chart).

If you don't really want to set all colors manually you will find 2 convenience methods for setting the bar colors which are setBetterColor() and setPoorerColor().

When calling these methods the poorerDarkerColor, poorerBrighterColor, betterDarkerColor and betterBrighterColor will automatically be set.

If you don't want to see a gradient for the bar fill you simply have to set the brighter and darker colors to the same values.

The easiest way to figure out how it works is to take a look at the ComparisonBarChartTest class.

This class contains the code for the screenshot above and should be starting point for your own version of the chart.

You will find this new ComparisonBarChart in the jdk17 branch of my JavaFX charts libray on github.

And of course it is also available on Maven Central...but keep in mind...you need to use JDK17 to run it...

That's it for today...so keep coding...