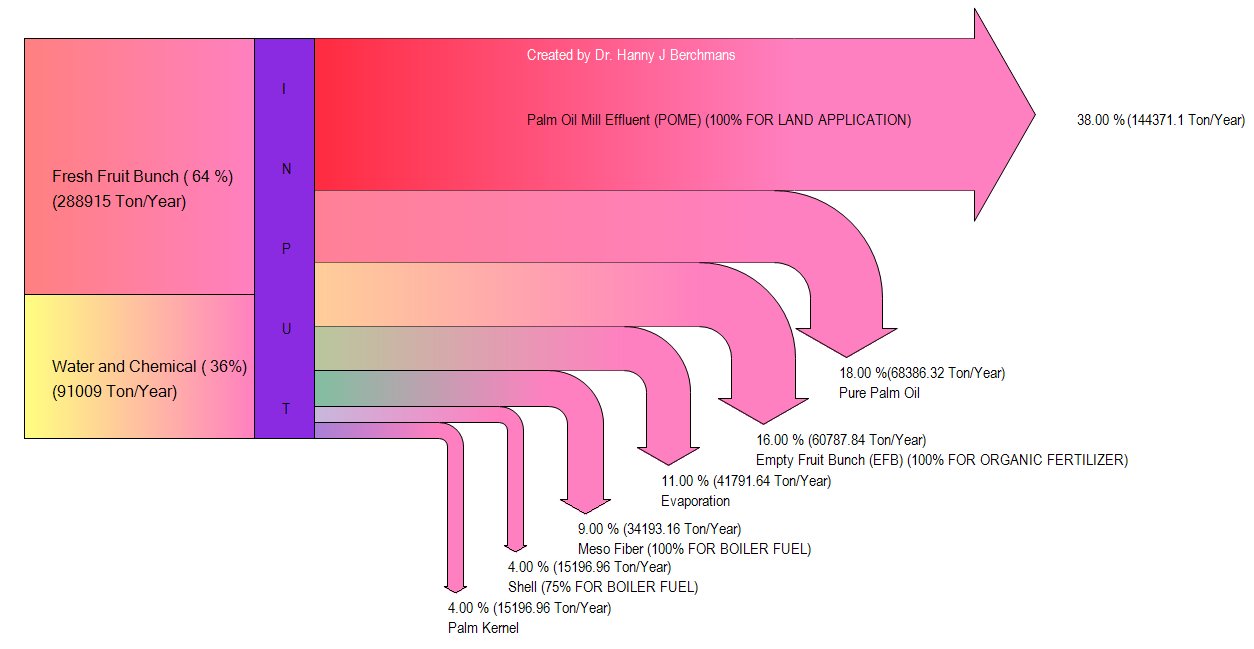
For the last Friday in 2017 I have another friday fun component for you. It's a variation of a donut chart where the segment width varies with the value. To give you an idea what this chart looks like here is a little picture that I've found on the web...

In principle this chart is not really fancy but the one thing that caught my attention are the shadows that are only visible on the lower elements, meaning to say they are not besides the segment. In JavaFX we have effects like drop shadows directly build in but they won't work here because if you would use a simple drop shadow on each segment you would get something like follows...

Well to be honest I was to lazy and decided to go another way. In principle you could imitate a drop shadow by using a linear gradient. This works but is not easy to achieve. So what I did was to add another segment at the end of each segment which I stroke with a linear gradient that goes from gray to transparent. To give it a little bit more realistic look I've also added a gaussian blur. So my result looks as follows...

UPDATE:
Well what I should I say...this shadow problem nagged me last night so I reworked my implementation and now I make use of the inbuild DropShadow effect in combination with clipping. On the following picture you can see the LinearGradient based approach (left) compared to the DropShadow approach (right)...

To make the effect more visible I've set the drop shadow color to opaque black on the right side and now the shadows look more natural...at least to me ;)
For the new approach I've added an additional path at the end of each segment and adjusted the shadow offset in x- and y-direction for each segment.
This worked nicely except the fact that the shadow also showed up outside of the segment.
Well a picture is better than thousand words, so on the following picture I've used plain red for the drop shadow color and here you can see what I'm talking about...

To avoid this problem I simply clip each segment with a circle that has the same radius and by using this little clipping trick the result looks like follows (with black as shadow color again)...

And now it looks exactly as I would like to see it :)
To use the clipping in JavaFX Canvas (or HTML5 Canvas) you have to define a path that will be used for the clipping and call clip() before you draw the elements that you would like to clip. The next thing you need to keep in mind is that once the clipping path is set it will affect all operations defined here.
In my case the problem is that the radius of the segments will increase so the clipping path also has to "grow". The canvas has a nice feature which makes it possible to save and restore it's state. Meaning to say before I set the clipping path I save the canvas by calling the save() method on the GraphicsContext and after I've finished the segment I reset the canvas to the saved state by calling the restore() method on the GraphicsContext. The nice thing is that you can save/restore the canvas as often as you like...but you have to keep track of it.
As a little advice let me tell you that if you use save/restore more than once it makes sense to either add some comments to each save/restore statement so that you know for which operation you save/restore or you also simply intend your code after each save statement to visualize the saved code blocks.
But now back to the chart...
For my implementation of the coxcomb chart the values of each segment are not related to the segment radius and therefor it only makes sense if you sort the items in the list.
For this reason I've added two convenience methods to sort the chart either ascending or descending where ascending would look like this...

I did not add a legend to the chart because I think this could be a separate control to be more flexible. I've created a simple item class that has properties for value, name and color.
To create the chart above you simply need the following code...
Item[] items = {
    new Item(27, Color.web("#96AA3B")),
    new Item(24, Color.web("#29A783")),
    new Item(16, Color.web("#098AA9")),
    new Item(15, Color.web("#62386F")),
    new Item(13, Color.web("#89447B")),
    new Item(5, Color.web("#EF5780"))
};
CoxcombChart chart = new CoxcombChart(items);
I'm always impressed how easy it is to create stuff like this in JavaFX, creating the control and writing this blog post tooks me only 2.5h which is one of the reasons why I love coding in JavaFX, the time from the first idea to some running code is really short and with this the productivity is really high and the code for the control is just around
Oh and if you are interested in the code you can find it as always on github.
This chart is very specific and does not work for everything but it could be quite useful for some special use cases and to be honest it simply looks nice :)
So I guess that's it for 2017, now I wish all of you a happy new year and...keep coding...